

Image Details
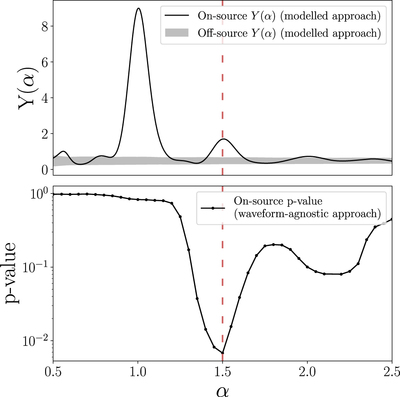
Caption: Figure 7.
Top panel: variation of Y(α), i.e., the energy in the pixels along the α-th track defined by fα(t) = αf22(t), using the modeled approach. The peaks at α = 1 and 1.5 indicate the energies in the m = 2 and m = 3 multipoles, respectively. The gray band indicates the 68% confidence interval on the off-source measurements of Y(α). Bottom panel: the variation of p-value of the on-source results, as a function of α, using the waveform-agnostic approach. The dip at α = 1.5 is strong evidence of the presence of the m = 3 mode in the underlying signal. The red dashed line in both panels corresponds to general relativity’s prediction of α = 1.5 for the m = 3 mode.
Other Images in This Article

Copyright and Terms & Conditions
© 2020. The American Astronomical Society.

