

Image Details
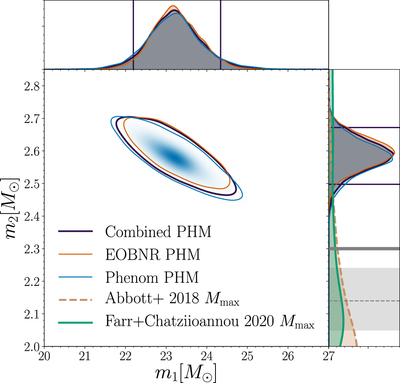
Caption: Figure 3.
Posterior distribution of the primary and secondary source masses for two waveform models that include precession and subdominant multipole moments. The posterior distribution resulting from combining their samples is also shown. Each contour, as well as the colored horizontal and vertical lines, shows the 90% credible intervals. The right panel compares m2 to predictions for the maximum NS mass, Mmax (see Section 6). The posterior distribution for Mmax from the spectral equation of state analysis of GW170817 (Abbott et al. 2018) is shown in orange, and the empirical Mmax distribution from the population model of Farr & Chatziioannou (2020) is shown in green. The gray dashed line and shading represent the measured mass of the heaviest pulsar in the Galaxy (median and 68% confidence interval; Cromartie et al. 2019). The solid gray band at 2.3 M⊙ is the upper bound on Mmax from studies of GW170817's merger remnant.
Other Images in This Article

Copyright and Terms & Conditions
© 2020. The American Astronomical Society.

