Image Details
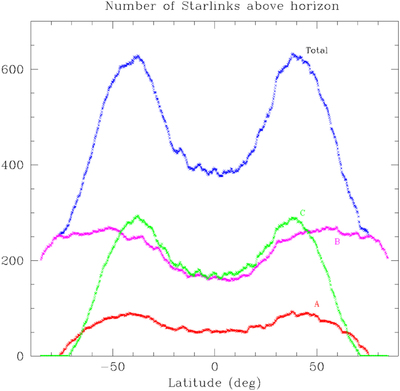
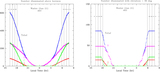
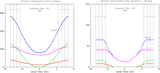
Caption: Figure 5.
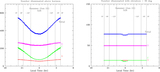
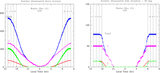
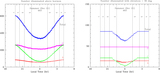
Simulated number of Starlink satellites above the horizon (but not necessarily illuminated) as a function of latitude. Separate contributions from layers A, B, and C are also shown. The finite number of satellites causes the irregularities in the curves. The figure illustrates that the number of satellites is largest at latitudes near the orbital inclination of the bulk of the satellites and smallest at the equator.
Other Images in This Article
Show More
Copyright and Terms & Conditions
© 2020. Contribution of Smithsonian Astrophysical Observatory; not subject to copyright in the United States.
Copyright ©
2026 Astronomy Image Explorer. All Rights Reserved.