Image Details
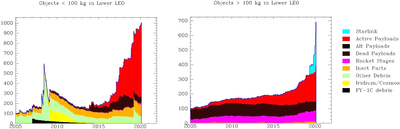
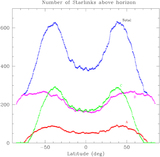
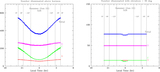
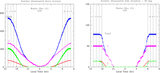
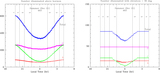
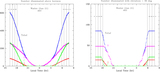
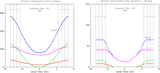
Caption: Figure 3.
Evolution of tracked artificial Earth satellite population in the 2005–2020 period, in lower LEO (200 to 600 km). Left: small (<100 kg) satellites. Right: large (>100 kg) satellites, including Starlink satellites. Small object population shows a rapid increase of small active payloads beginning in 2016 (the “cubesat revolution”). Large object population shows a recent spike as Starlink satellites begin to dominate in 2020. Objects contributing to the large object population in this figure are likely to be visible to the naked-eye.
Other Images in This Article
Show More
Copyright and Terms & Conditions
© 2020. Contribution of Smithsonian Astrophysical Observatory; not subject to copyright in the United States.
Copyright ©
2026 Astronomy Image Explorer. All Rights Reserved.