Image Details
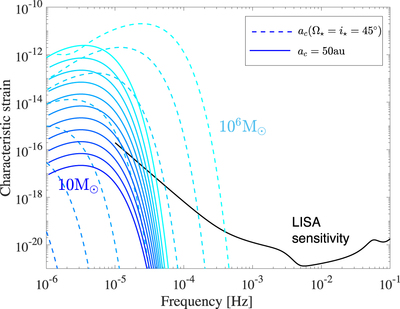
Caption: Figure 5.
Characteristic strain as a function of frequency. We consider the GW signal from an SMBH binary located at a = 50 au (solid lines) as well as ac(Ω⋆ = i⋆ = 45°), which corresponds to the red dashed line from the left panel in Figure 3. We consider a range of masses varying from 10 M⊙ (dark blue) to 106 M⊙ (light blue). In all cases we adopt ec = 0.9. We adopt a LISA observational time of 4 yr. The LISA noise sensitivity is shown in black (Robson et al. 2018).
Other Images in This Article
Copyright and Terms & Conditions
© 2019. The American Astronomical Society. All rights reserved.
Copyright ©
2026 Astronomy Image Explorer. All Rights Reserved.