Image Details
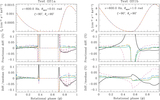
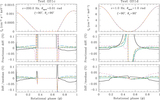
Caption: Figure 5.
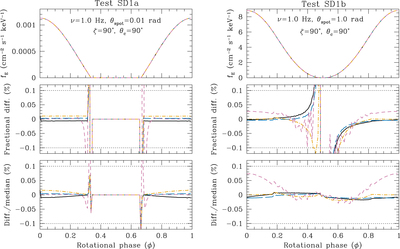
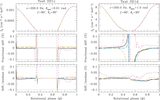
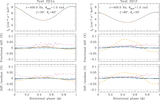
Comparisons of the synthetic pulse waveforms from Tests SD1a and SD1b, the slowly spinning (1 Hz) variations of the SD1 tests (see Table 1 for the assumed parameters). The point-like (﹩{\theta }_{\mathrm{spot}}=0.01﹩ rad) and large spot (θspot = 1 rad) are shown on the left and right, respectively. The top panel shows the pulse waveforms. The middle panel shows the fractional difference between the CU (black), GSFC-M (orange), GSFC-S (blue), and Alberta (purple) photon fluxes compared to the IM flux at each phase bin, expressed as a percentage. In the bottom panel, the IM flux is subtracted from the other fluxes and the result is divided by the median IM flux over all phases. The two horizontal dotted lines mark the target ±0.1% measurement precision. Except near the spot eclipse ingress and egress, where the flux is two orders of magnitude smaller than it is at the peak, the agreement between the codes is significantly better than the target precision.
Other Images in This Article
Show More
Copyright and Terms & Conditions
© 2019. The American Astronomical Society. All rights reserved.