Image Details
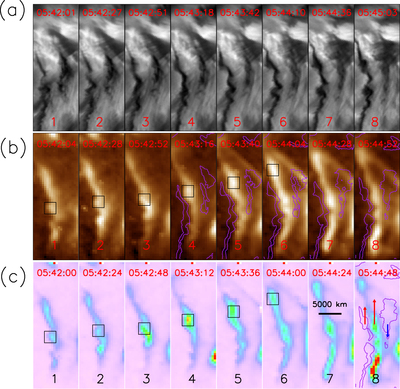
Caption: Figure 2.
(a) Plasma flow evolution observed by the NVST ﹩{{\rm{H}}}_{\alpha }﹩ channel. (b) Coronal flow component observed by the AIA 193 Å channel. The contours overlaid in the fourth–eighth snapshots are based on the NVST Hα emission intensities displayed in panel (a). It shows that boundaries of the coronal and chromospheric flow components complement each other at the contact surface. (c) DEM at T = 1250,000 K. Uniform time stamps of 1–8 are allocated to each snapshot, although the measurements for each instrument are taken at slightly shifted times. The contours and arrows plotted in the eighth frame in panel (c) give the relative motions of the plasma material; the lengths of the arrows are scaled with the speed value, i.e., ﹩28\,\mathrm{km}\,{{\rm{s}}}^{-1}﹩, ﹩40\,\mathrm{km}\,{{\rm{s}}}^{-1}﹩ ,and ﹩-21\,\mathrm{km}\,{{\rm{s}}}^{-1}﹩, respectively. An animation of panels (a) and (b) is provided in Figure 1.
Other Images in This Article
Copyright and Terms & Conditions
© 2019. The American Astronomical Society. All rights reserved.