Image Details
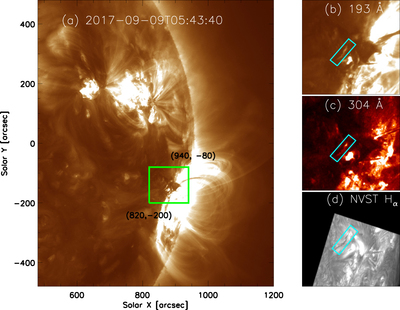
Caption: Figure 1.
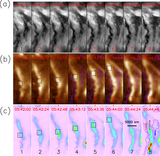
(a) Field of view of the AIA 193 Å channel showing the plasma motion on the northeast outskirt of AR 12673. (b)–(d) Highlights of the region of interest (the green box in panel (a)) in the 193 Å, 304 Å, and NVST ﹩{{\rm{H}}}_{\alpha }﹩ images, respectively. The areas enclosed by the tilted rectangles are erected in Figure 2 to visualize the plasma motion. An animation of the 193 Å, 304 Å, and NVST ﹩{{\rm{H}}}_{\alpha }﹩ images is available. The area in the tilted rectangles in 193 Å and ﹩{{\rm{H}}}_{\alpha }﹩ is also animated to show the plasma flow evolution. The entire animation runs from to 05:00 to 06:30 UT.
(An animation of this figure is available.)
The video/animation of this figure is available in the online journal.
Other Images in This Article
Copyright and Terms & Conditions
© 2019. The American Astronomical Society. All rights reserved.