Image Details
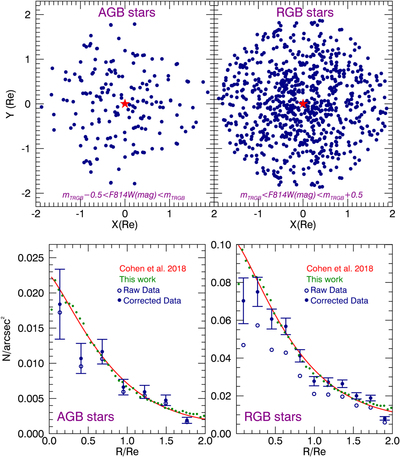
Caption: Figure 3.
Spatial distribution and radial profiles of the stars detected above (AGBs) and below (RGBs) the TRGB of NGC 1052-DF4. Top panels: spatial distribution around the central position of the galaxy (red cross). The distance is indicated in Re units. Note how the stars found tend to group around the central part of NGC 1052-DF4 as expected. Bottom panels: number density profiles of the stars detected around the TRGB. Open blue symbols correspond to the number density of the stars detected without applying any completeness correction, while solid blue symbols are the number of stars estimated after the completeness correction. Overplotted to the radial profiles of the stars is the surface brightness profile of the galaxy obtained using the IRAF ELLIPSE code (green points) and the Sérsic model fit to the surface brightness distribution provided in Cohen et al. (2018; red line).
Other Images in This Article
Copyright and Terms & Conditions
© 2019. The American Astronomical Society. All rights reserved.