Image Details
Caption: Figure 1.
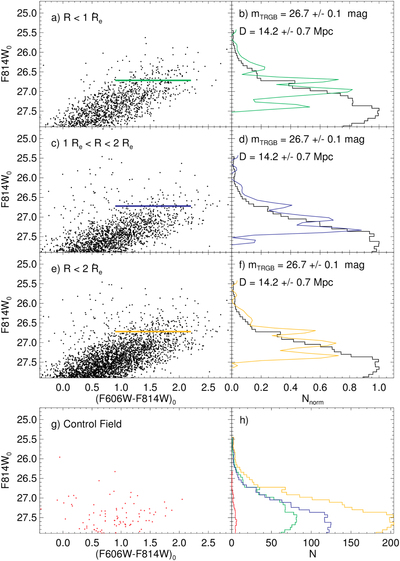
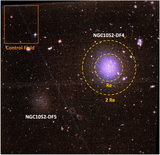
Left panels a), c), and e): de-reddened CMD of NGC 1052-DF4 stars as a function of radius: within 1 Re (R < 16.″5, panel a), between 1 Re and 2 Re (panel c), and within 2 Re (panel e). Panel g) presents the CMDs of a control field of similar area located at ∼7.5 Re from the center of NGC 1052-DF4. Right panels b), d), and f): LFs (all normalized to peak at one; black histograms) and filter responses (colored lines). These were used to identify the location of the TRGB, which is marked by the horizontal lines in the left panels. Panel h) presents the superposition of the three LFs (using the same color used to display the corresponding filter curve) compared to the control field (in red). While the jump in the LF due to TRGB clearly happens at very similar magnitude for the first three curves, the control field presents a significantly different distribution, with the LF peaking ≈1 mag fainter.
Other Images in This Article
Copyright and Terms & Conditions
© 2019. The American Astronomical Society. All rights reserved.