Image Details
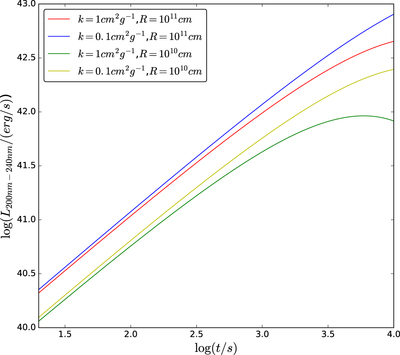
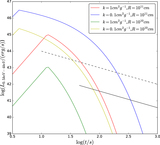
Caption: Figure 2.
Light curves of the UV emission in the range of 200–240 nm from the cooling of the cocoon. The parameter values of the cocoon used in the calculation are the same as those used in Figure 1. Note that the cocoon emission lasts only until the lowest velocity shell with ﹩\gamma \beta \gt 1﹩ becomes transparent. See Equation (15) in the text for the estimate of this time.
Other Images in This Article
Copyright and Terms & Conditions
© 2018. The American Astronomical Society.
Copyright ©
2025 Astronomy Image Explorer. All Rights Reserved.