Image Details
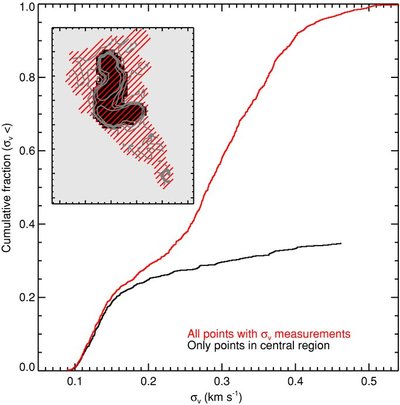
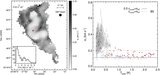
Caption: Figure 5.
Velocity dispersion cumulative distribution. Red curve shows the cumulative distribution for all points with good velocity dispersion measurements, while the black curve uses only points close to the central core. The sharp transition in velocity dispersion produces a change in the cumulative distribution's slope, which can be observed both locally (central region) and globally (entire map). The inset shows the spatial distribution of the points used, and velocity dispersion contours are overlaid in gray.
Other Images in This Article
Copyright and Terms & Conditions
© 2010. The American Astronomical Society. All rights reserved.
Copyright ©
2026 Astronomy Image Explorer. All Rights Reserved.