Image Details
Caption: Figure 2.
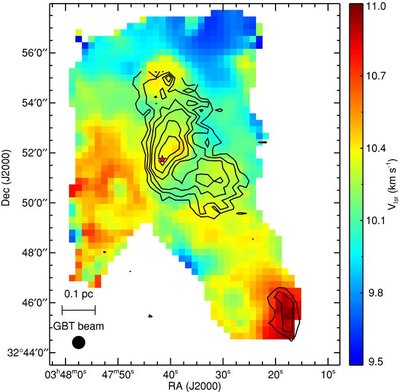
Centroid velocity map of B5 obtained by fitting the NH 3 lines. The position of the protostar is shown by the star. Black contours are BOLOCAM dust continuum emission (Enoch et al. 2006). The GBT beam size is shown at the bottom left.
Other Images in This Article
Copyright and Terms & Conditions
© 2010. The American Astronomical Society. All rights reserved.
Copyright ©
2026 Astronomy Image Explorer. All Rights Reserved.