

Image Details
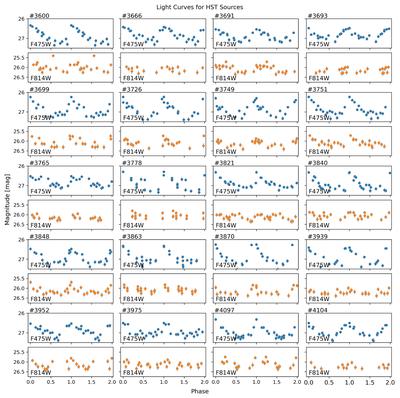
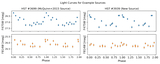
Caption: Figure B1.
The full set of phase-folded light curves from the RR Lyrae identified in the HST data herein. Both the F475W (blue) and F814W (orange) data are shown for each source. The magnitude axes have a range of 1.5 mag for both filters, in order to best show the variability while emphasizing the differences in amplitude between the filters without obscuring any epochs. Two cycles are shown for viewing convenience.
Other Images in This Article
Show More
Copyright and Terms & Conditions
© 2026. The Author(s). Published by the American Astronomical Society.

Copyright ©
2026 Astronomy Image Explorer. All Rights Reserved.
