

Image Details
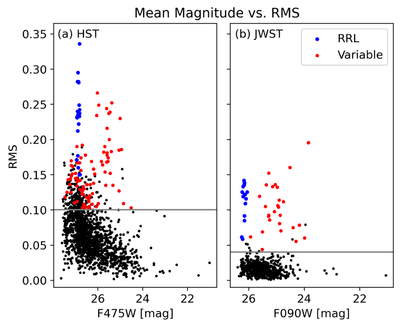
Caption: Figure 2.
Plots showing the mean magnitudes vs. rms variability for the HST (left) and JWST (right) observations. Note that only sources which pass the initial photometry and epoch number requirements are shown. The sources which are flagged as variable in the initial identification are shown in red, sources which are eventually confirmed to be RR Lyrae are shown in blue, while nonvariable sources are shown in black. The rms cutoffs (0.1 for HST; 0.04 for JWST) are indicated with gray horizontal lines. Sources which exceed the rms threshold but are not flagged as variable are removed by either the χ2 or periodicity metric filters.
Other Images in This Article
Show More
Copyright and Terms & Conditions
© 2026. The Author(s). Published by the American Astronomical Society.

