

Image Details
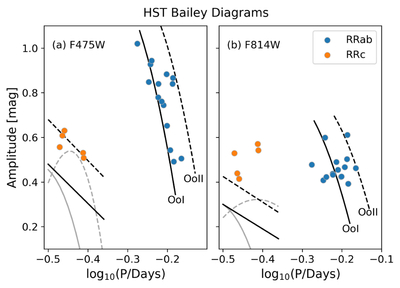
Caption: Figure 5.
The Bailey diagrams for the HST F475W (left) and F814W (right) data. Note the separation between the RRab (blue) and RRc (orange) sources, where the RRab sources generally have greater amplitudes and longer periods. Lines show the empirical loci for Oosterhoff Type I (OoI; solid) and Oosterhoff Type II (OoII; dashed) globular clusters (C. Cacciari et al. 2005; A. Arellano Ferro et al. 2023). V-band loci are plotted with the F475W data, and I-band loci with the F814W data. The black lines show loci for both RRab (parabolic) and RRc (linear) sources, reported in A. Kunder et al. (2013a) from observations of NGC 2808. For the RRc sources, more recent parabolic loci are also shown in gray. The OoI parabolic loci for both bands are reported in A. Arellano Ferro et al. (2015) using NGC 6229 observations. The V-band OoII parabolic locus is reported in A. Kunder et al. (2013b) using NGC 6656 observations. Finally, the I-band OoII parabolic locus is reported in M. A. Yepez et al. (2020) using NGC 6656 observations.
Other Images in This Article
Show More
Copyright and Terms & Conditions
© 2026. The Author(s). Published by the American Astronomical Society.

