

Image Details
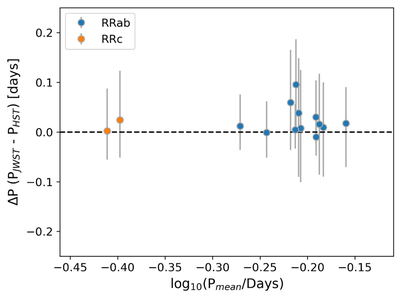
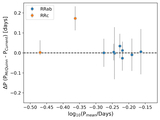
Caption: Figure 14.
The difference in the MCMC best-fit periods derived from the JWST and HST data, for the co-observed sources. The expected value of the difference (zero) is indicated by the dashed black line. The source type (which is agreed upon by the two fits in all cases) is indicated by color (RRab in blue; RRc in orange).
Other Images in This Article
Show More
Copyright and Terms & Conditions
© 2026. The Author(s). Published by the American Astronomical Society.

Copyright ©
2026 Astronomy Image Explorer. All Rights Reserved.
