

Image Details
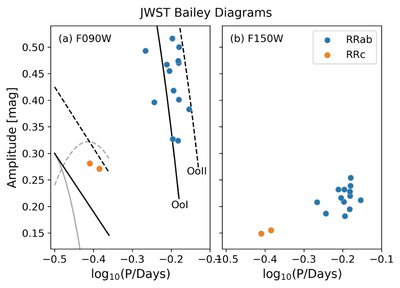
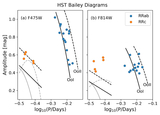
Caption: Figure 11.
The Bailey diagrams made from the JWST F090W (left) and F150W (right) data. Note the separation between the RRab (blue) and RRc (orange) populations. The RRc sources have, on average, smaller amplitudes and shorter periods. Additionally note the reduced amplitudes in the F150W filter as compared to the bluer F090W filter. The I-band empirical loci for globular cluster Oosterhoff classification from Figure 5 are plotted alongside the F090W data.
Other Images in This Article
Show More
Copyright and Terms & Conditions
© 2026. The Author(s). Published by the American Astronomical Society.

Copyright ©
2026 Astronomy Image Explorer. All Rights Reserved.
