

Image Details
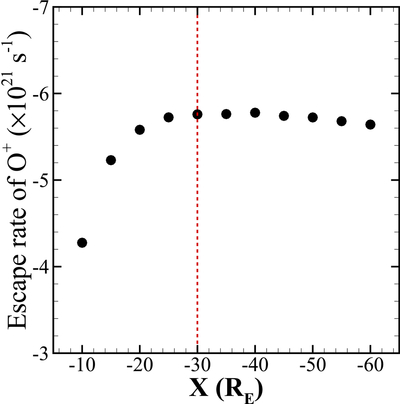
Caption: Figure B2.
Variation of the net O+ ion flux along the X-axis in the magnetotail for the case shown in Figure 1. The vertical axis represents the integrated ion flux (in units of s−1) over each Y–Z cross section. Negative values indicate tailward flux. The red dashed line marks X = −30 RE, beyond which the net O+ flux converges to a roughly constant value, indicating the establishment of a steady escape rate for this case.
Other Images in This Article
Copyright and Terms & Conditions
© 2026. The Author(s). Published by the American Astronomical Society.

Copyright ©
2026 Astronomy Image Explorer. All Rights Reserved.
