

Image Details
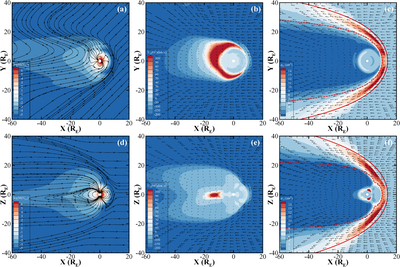
Caption: Figure 1.
Simulation results of spatial distributions of ion densities and velocities in the X–Y plane (top row) and X–Z plane (bottom row) under the present-day geomagnetic dipole moment strength with a dipole tilt angle of 0∘. Panels (a) and (d) show the logarithmic number density of O+ (in cm−3 units), with black solid lines representing magnetic field lines. Panels (b) and (e) display the X-component of O+ velocity (in kilometers per second), with vectors showing the projected O+ velocity field. Panels (c) and (f) show the number density of H+ (in cm−3 units), with vectors showing the projected H+ velocity field. The red dashed and solid lines in panels (c) and (f) indicate the magnetopause model results from Z. Q. Liu et al. (2015) and the bow shock model results from J. Y. Lu et al. (2019), respectively, under corresponding solar wind conditions.
Other Images in This Article
Copyright and Terms & Conditions
© 2026. The Author(s). Published by the American Astronomical Society.

