

Image Details
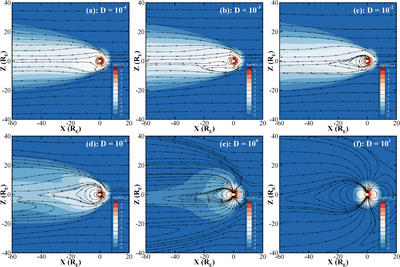
Caption: Figure 2.
Meridional (X–Z) plane distributions of O+ logarithmic number density (in units of cm−3) under varying geomagnetic dipole moment strengths at a dipole tilt angle of 0∘. Panels (a)–(f) correspond to D = 10−4, 10−3, 10−2, 10−1, 100 (present-day value), and 101, respectively, where D denotes the dipole moment strength normalized to the present-day value. Black solid lines represent magnetic field lines.
Other Images in This Article
Copyright and Terms & Conditions
© 2026. The Author(s). Published by the American Astronomical Society.

Copyright ©
2026 Astronomy Image Explorer. All Rights Reserved.
