

Image Details
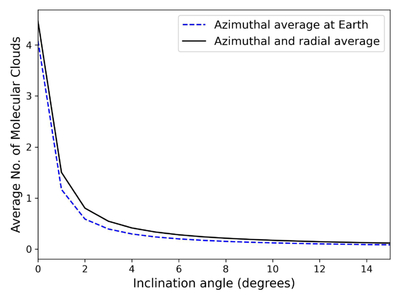
Caption: Figure A1.
Average number of molecular clouds intersected by sightlines at different inclination angles from the Galactic plane. The dashed blue curve shows the average over all azimuthal angles for a point 8 kpc from the Galactic center (roughly the Sun/Earth distance), while the solid black line corresponds to the average over all azimuthal angles as well as over all points along the radial direction.
Other Images in This Article
Copyright and Terms & Conditions
© 2026. The Author(s). Published by the American Astronomical Society.

Copyright ©
2026 Astronomy Image Explorer. All Rights Reserved.
