

Image Details
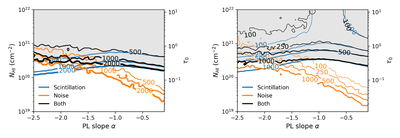
Caption: Figure 5.
Shown are 5σstack significance contours of H I absorption detection as a function of NH I and the power-law fluence CDF index α. The contours highlight a comparison between cases when only scintillation is present (blue lines), when only detector noise is present (orange lines), and when both are present (black lines). (Left) Mock observations correspond to FAST (SEFD = 1.36 Jy) with stack sizes of 500, 1000, and 2000 bursts. The CDF is sampled between 0.05 − 5 Jy ms. (Right) Mock observations correspond to GBT (SEFD =8.25 Jy) with stack sizes of 100, 250, 500, and 1000 bursts. The CDF is sampled between 0.5 − 70 Jy ms. 〈δνsdc〉 ≈ 28 kHz, and δνobs = 20 kHz for both panels. The light gray shaded region shows the detectable parameter space with the corresponding panel’s thickest contour. The right vertical axis shows the line-center optical depth (τ0; Equation (2)) based on the cloud properties, which are fixed to Tspin = 50 K and d ≈ 18 pc.
Other Images in This Article
Copyright and Terms & Conditions
© 2026. The Author(s). Published by the American Astronomical Society.

