

Image Details
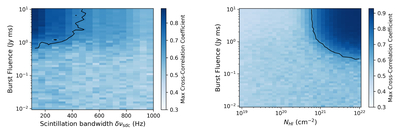
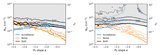
Caption: Figure 4.
These plots show the averaged maximum cross-correlation coefficient (in color) obtained by cross-correlating the input flat spectrum profile (like the red dashed line in Figure 2) with a single burst mock spectrum, scintillation and noise included, for FAST with SEFD =1.36 Jy. The vertical axis shows the single burst fluence measured at offline frequencies. (Left) The horizontal axis shows the scintillation bandwidth, with the correlation coefficient being averaged over 20 bursts. NH I ≈ 9 × 1020 cm−2. (Right) The horizontal axis shows the H I column density, with the correlation coefficient averaged over 50 bursts. 〈δνsdc〉 = 0.3 kHz. For both plots, the black contour line indicates a maximum cross-correlation coefficient of 0.7. d = 20 pc and Tspin = 50 K.
Other Images in This Article
Copyright and Terms & Conditions
© 2026. The Author(s). Published by the American Astronomical Society.

