

Image Details
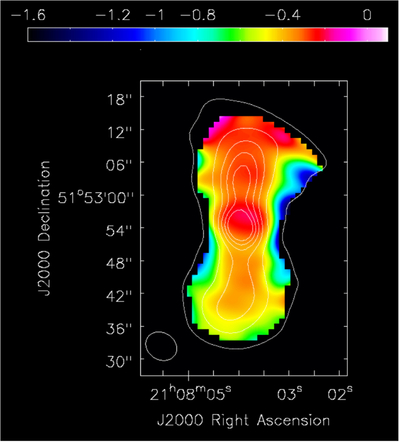
Caption: Figure 3.
Spectral index (α) map of GMRText derived between uGMRT band 3 (400 MHz) and band 5 (1.2 GHz) after matching the angular resolution. The color scale represents the spatial variation of the spectral index across the source. Contours are overlaid from the band 5 (1.2 GHz) image at 10σ, 100σ, 200σ, 300σ, 400σ, and 500σ levels.
Other Images in This Article
Copyright and Terms & Conditions
© 2026. The Author(s). Published by the American Astronomical Society.

Copyright ©
2026 Astronomy Image Explorer. All Rights Reserved.
