

Image Details
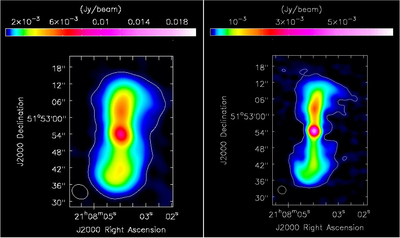
Caption: Figure 1.
Left: morphology of GMRT extended source (GMRText) in 400 MHz emission map obtained in uGMRT observation. The image is characterized by a synthesis beam ∼5﹩\mathop{.}\limits^{{\unicode{x02033}}}﹩96 × 4﹩\mathop{.}\limits^{{\unicode{x02033}}}﹩93 with position angle (P.A.) = 57﹩\mathop{.}\limits^{{\unicode{x000b0}}}﹩9, shown in the bottom-left corner of the image. The average rms noise of the image is ∼23 μJy. The contour shows the sources with 5σ significance in the emission map. Right: morphology of GMRText in 1.2 GHz emission map obtained in uGMRT observation. The image is characterized by a synthesis beam ∼3﹩\mathop{.}\limits^{{\unicode{x02033}}}﹩02 × 2﹩\mathop{.}\limits^{{\unicode{x02033}}}﹩86 with P.A. =52﹩\mathop{.}\limits^{{\unicode{x000b0}}}﹩5 shown in the bottom-left corner of the image. The average rms noise of the image is ∼8 μJy. The contour shows the sources with 5σ significance in the emission map.
Other Images in This Article
Copyright and Terms & Conditions
© 2026. The Author(s). Published by the American Astronomical Society.

