

Image Details
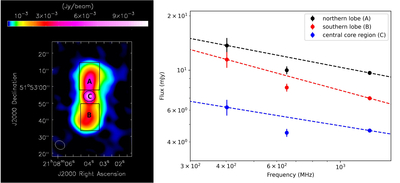
Caption: Figure 2.
Left: uGMRT image of GMRText at 400 MHz, showing the regions used for spatially resolved spectral analysis. The rectangular boxes mark the northern (A) and southern (B) lobes, while the central circular region (C) denotes the core. The synthesized beam is shown in the bottom-left corner. Right: spatially resolved radio spectra of the three regions, derived from flux densities measured in the resolution-matched images across bands 3, 4, and 5. The dashed lines represent PL fits to the data points.
Other Images in This Article
Copyright and Terms & Conditions
© 2026. The Author(s). Published by the American Astronomical Society.

Copyright ©
2026 Astronomy Image Explorer. All Rights Reserved.
