

Image Details
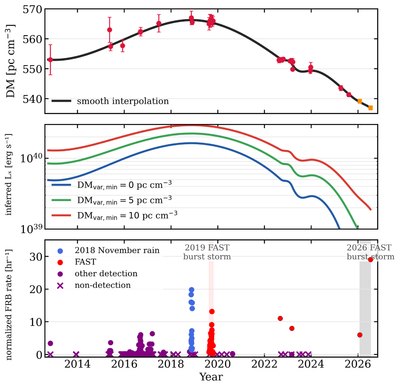
Caption: Figure 3.
Comparison of the observed DM evolution of FRB 121102 with the ionizing luminosity history inferred in the photoionization model, and with the radio burst activity history. Top: binned DM measurements from Table 2 of E. Waxman et al. (2026), together with recent FAST measurements reported by J. Zhang et al. (2026a, 2026b). The black curve shows a smooth interpolation used only to guide the eye and to estimate the slowly varying component of the DM. Middle: ionizing luminosity inferred from the interpolated DM evolution using Equation (48), shown for three choices of the minimum variable source-local contribution, ﹩{{\rm{DM}}}_{{\rm{var}},{\rm{\min }}}﹩. Bottom: normalized L-band FRB activity rates, following the fluence-threshold normalization of C. A. Braga et al. (2025). Purple circles and crosses denote detections and nondetections, respectively; blue points mark the 2018 November “rain” of bursts; red points mark FAST detections, including the 2019 FAST burst storm and the more recent high-activity FAST epochs reported by P. Wang et al. (2025) and J. Zhang et al. (2026a, 2026b). The 2026 FAST rates have been rescaled to the same fiducial fluence threshold used for the normalized activity rates. The shaded regions mark the 2019 and 2026 FAST burst-storm epochs.
Other Images in This Article
Copyright and Terms & Conditions
© 2026. The Author(s). Published by the American Astronomical Society.

