

Image Details
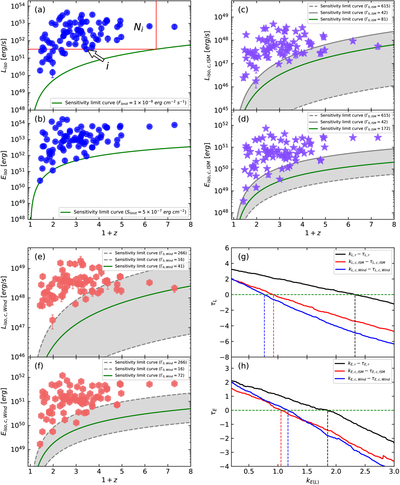
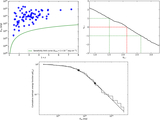
Caption: Figure 4.
Distributions and correlations of isotropic energy and luminosity for the Γ0 sample: panels (a), (c), and (e) show the distributions of luminosity with redshift in the rest frame and comoving frame, with the green curves indicating the effective sensitivity limit of Flimit = 1 × 10⁻⁸ erg cm−2 s−1. Similarly, panels (b), (d), and (f) display the distributions of isotropic energy with redshift, with the green curves representing the effective sensitivity limit of Slimit = 5 × 10⁻⁷erg cm−2. Panels (g) and (h) present the Kendall τ correlation tests (k–τ relation) for luminosity and isotropic energy in the two reference frames, respectively.
Other Images in This Article
Copyright and Terms & Conditions
© 2026. The Author(s). Published by the American Astronomical Society.

