

Image Details
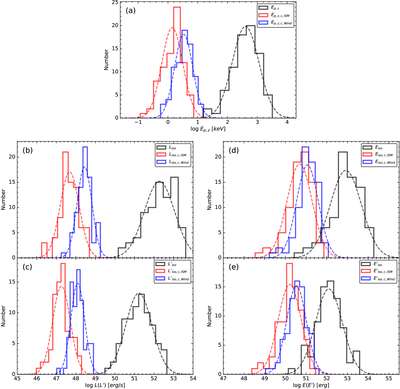
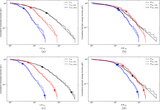
Caption: Figure 2.
Distributions of the peak energy, isotropic energy, and luminosity in the rest frame (black lines) and the comoving frame (red and blue lines). Panels (e) and (c) show the redshift-evolution-corrected isotropic energy and luminosity, respectively. The dashed lines represent the best-fitting curves.
Other Images in This Article
Copyright and Terms & Conditions
© 2026. The Author(s). Published by the American Astronomical Society.

Copyright ©
2026 Astronomy Image Explorer. All Rights Reserved.
