

Image Details
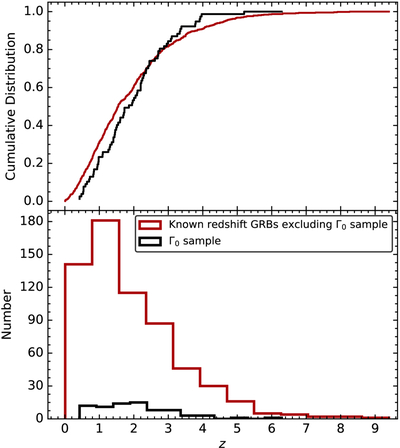
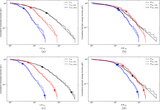
Caption: Figure 1.
The redshift distribution of the Γ0 sample (black histogram) and the redshift distribution of all known z for GRBs (red histogram). The black and red step lines represent the corresponding cumulative redshift distributions obtained from the K-S test.
Other Images in This Article
Copyright and Terms & Conditions
© 2026. The Author(s). Published by the American Astronomical Society.

Copyright ©
2026 Astronomy Image Explorer. All Rights Reserved.
