

Image Details
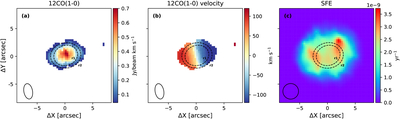
Caption: Figure 3.
CO distribution of PGC 66551. (a) and (b) The integrated intensity in Jy beam–1 km s−1 and velocity of CO, using a threshold of 2.7 mJy (∼5σrms). The beam size is shown at the bottom-left corner. (c) Spatial distribution of SFE. The black dashed lines in panels (a) and (b) are the same as Figure 1. The black ellipse in panel (c) presents the new beam size after the convolution.
Other Images in This Article
Copyright and Terms & Conditions
© 2026. The Author(s). Published by the American Astronomical Society.

Copyright ©
2026 Astronomy Image Explorer. All Rights Reserved.
