

Image Details
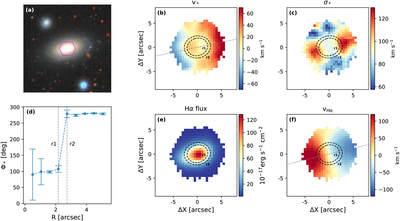
Caption: Figure 1.
Images and spatially resolved properties of PGC 66551. (a) DESI grz color image. (b) and (c) Distributions of stellar velocity and velocity dispersion. (d) PAs of stellar disk as functions of radii. The sharp discontinuity (r1 and r2) is interpreted as the boundary between the inner and outer stellar disks. (e) and (f) Distributions of Hα flux and velocity. The gray dashed lines in panels (b) and (f) show the major axes of the velocity field fitted by the PYTHON module FIT_KINEMATIC_PA (D. Krajnović et al. 2006). The black dashed lines in (b), (c), (e) and (f), mark the boundary defined in (d).
Other Images in This Article
Copyright and Terms & Conditions
© 2026. The Author(s). Published by the American Astronomical Society.

Copyright ©
2026 Astronomy Image Explorer. All Rights Reserved.
