

Image Details
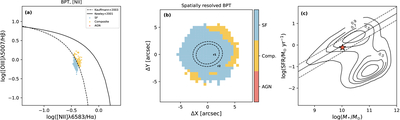
Caption: Figure 2.
Diagnostic diagrams of PGC 66551. (a) BPT diagram. Solid lines, as defined by L. J. Kewley et al. (2001), and dotted lines, as defined by G. Kauffmann et al. (2003), represent demarcation curves delineating regions associated with star formation, composite, and active galactic nucleus (AGN) regions. (b) Spatially resolved BPT diagram. The black dashed lines in (b) are the same as Figure 1. (c) SFR versus stellar mass. The black solid line represents the main-sequence relation from Y.-Y. Chang et al. (2015) where the dashed lines show the 1σ scatter. PGC 66551 is shown as the red star.
Other Images in This Article
Copyright and Terms & Conditions
© 2026. The Author(s). Published by the American Astronomical Society.

Copyright ©
2026 Astronomy Image Explorer. All Rights Reserved.
