

Image Details
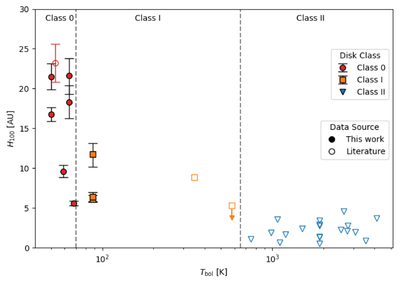
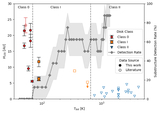
Caption: Figure 7.
Dust scale height at R = 100 au, H100, as a function of bolometric temperature Tbol for protostellar and PPDs spanning Class 0, Class I, and Class II evolutionary stages. Filled symbols represent sources modeled in this work, while open symbols denote values compiled from the literature; details of their derivation are provided in the text. Downward-pointing triangles denote upper limits. The dashed vertical lines mark the adopted boundaries between evolutionary classes based on Tbol. The downward arrow associated with HL Tau, shown as the open square near the second vertical dashed line, indicates that its H100 value is an upper limit. The overall decrease in H100 as Tbol increases suggests progressive dust settling and disk flattening with evolutionary age.
Other Images in This Article
Copyright and Terms & Conditions
© 2026. The Author(s). Published by the American Astronomical Society.

