

Image Details
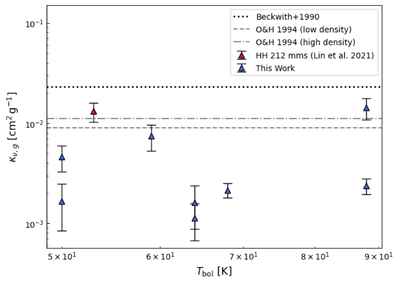
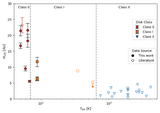
Caption: Figure 6.
Lower limits on the opacity at 1.3 mm, κν,g, derived assuming Q = 1, as a function of bolometric temperature, Tbol. Blue triangles denote sources modeled in this work, while the red triangle represents the Class 0 disk HH 212 mms from Z.-Y. D. Lin et al. (2021). Upward-pointing triangles indicate lower limits. The horizontal lines mark commonly adopted opacity values from S. V. W. Beckwith et al. (1990) (dotted line) and V. Ossenkopf & T. Henning (1994) (dashed and dashed–dotted lines for the low- and high-density models, respectively). The dust opacity values reported by V. Ossenkopf & T. Henning (1994) have been converted to κν,g (cross section per gram of gas including dust); details of this conversion are provided in the text.
Other Images in This Article
Copyright and Terms & Conditions
© 2026. The Author(s). Published by the American Astronomical Society.

