

Image Details
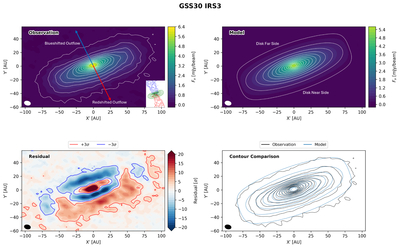
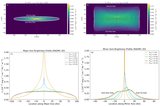
Caption: Figure 5. Observed and Modeled Continuum Emission for the Full Sample
The complete figure set (9 images) is available in the online journal.
Comparison between the observed and modeled continuum emission for GSS30 IRS3. The upper-left panel shows the observed continuum image. The inset shows the CO molecular outflow from A. Santamaría-Miranda et al. (2024), with the blue and red arrows indicating the projected directions of the blueshifted and redshifted outflows, respectively. The outflow geometry provides an independent constraint on the disk’s near- and far-side orientation. The upper-right panel shows the corresponding best-fit RADMC-3D model, with the modeled near and far sides of the disk labeled. The modeled near- and far-side orientations agree with those inferred independently from the observed outflow geometry. The lower-left panel displays the residual map, defined as the observed image minus the model image, with red and blue contours marking the +3σ and −3σ residual levels, respectively. The lower-right panel compares the observed (black) and modeled (blue) intensity contours, illustrating the overall agreement in morphology and spatial extent. The same contour levels are used for the observed and modeled images; the lowest contour is set at 5σ, while the remaining contours are linearly spaced up to 80% of the observed peak intensity, corresponding approximately to [20, 41, …, 230, 250, 271]σ.
Other Images in This Article
Copyright and Terms & Conditions
© 2026. The Author(s). Published by the American Astronomical Society.

