

Image Details
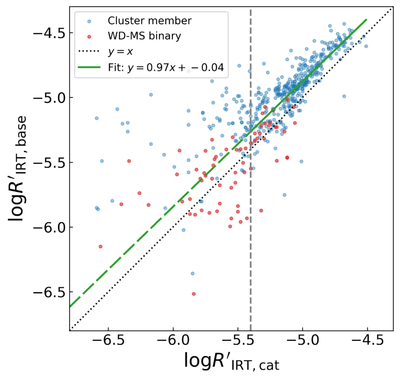
Caption: Figure 4.
Comparison of log﹩{R}_{{\rm{IRT}},{\rm{base}}}^{{\prime} }﹩ and log﹩{R}_{{\rm{IRT}},{\rm{cat}}}^{{\prime} }﹩ measurements. Blue dots represent OC members, and red dots denote WD-MS binaries. The green line represents a linear fit to sources with log﹩{R}_{{\rm{IRT}},{\rm{cat}}}^{{\prime} }﹩ > −5.4. The black dashed line denotes a unity line. The gray dashed line is placed at log﹩{R}_{{\rm{IRT}},{\rm{cat}}}^{{\prime} }﹩ = −5.4, below which the ﹩{R}_{{\rm{IRT}},{\rm{cat}}}^{{\prime} }﹩ measurements may be unreliable (S. Freund et al. 2025).
Other Images in This Article
Copyright and Terms & Conditions
© 2026. The Author(s). Published by the American Astronomical Society.

Copyright ©
2026 Astronomy Image Explorer. All Rights Reserved.
