

Image Details
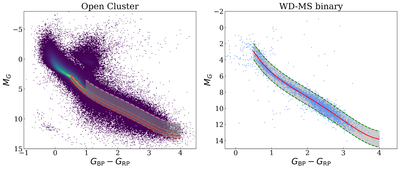
Caption: Figure 1.
H-R diagram of the initial sample. Left panel: the OC sample taken from E. L. Hunt & S. Reffert (2023). The red solid line corresponds to the fitted MS locus. Red dashed lines are shifted by ±0.5 mag relative to the fitted curve, while the pink dashed line is obtained by shifting the fitted curve upward by 2 mag. The shaded region is used to select the initial sample. Right panel: the WD-MS binary sample. Blue dots represent the MS components of WD-MS binaries. The red solid line corresponds to the fitted MS locus. Green dashed lines are shifted by ±1 mag relative to the fitted curve. The shaded region is used to select the initial sample.
Other Images in This Article
Copyright and Terms & Conditions
© 2026. The Author(s). Published by the American Astronomical Society.

