

Image Details
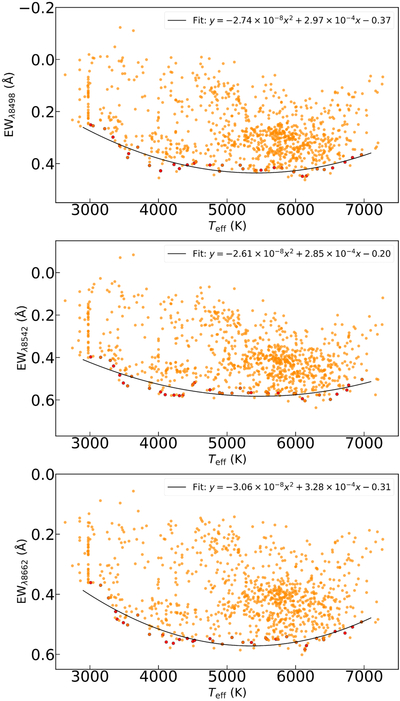
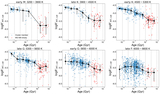
Caption: Figure 3.
EW distribution of our sample stars (method 2). Red dots denote the fitting points. Black lines represent the fitting to the most inactive stars, which were used as the photometric and and nonmagnetic chromospheric contribution (EWphot) to each Ca II IRT line.
Other Images in This Article
Copyright and Terms & Conditions
© 2026. The Author(s). Published by the American Astronomical Society.

Copyright ©
2026 Astronomy Image Explorer. All Rights Reserved.
