

Image Details
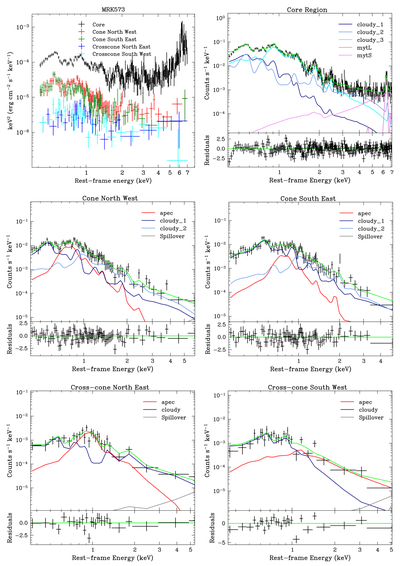
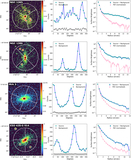
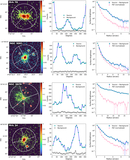
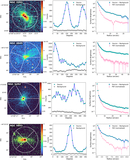
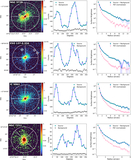
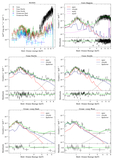
Caption: Figure 8.
Top-left panel: unfolded Chandra spectra extracted from the regions defined in the corresponding panels of Figure 3. The remaining panels show the individual spectra and corresponding best-fit models for the various regions.
Other Images in This Article
Show More
Copyright and Terms & Conditions
© 2026. The Author(s). Published by the American Astronomical Society.

Copyright ©
2026 Astronomy Image Explorer. All Rights Reserved.
