

Image Details
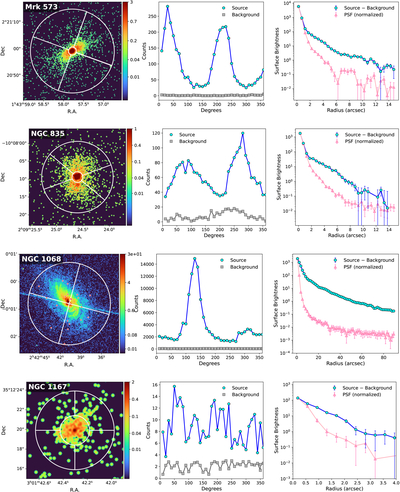
Caption: Figure 3.
Characterization of the spatial distribution of the 0.3–7 keV X-ray emission. Left panel: Chandra image in the 0.3–7 keV band with the spectral extraction regions overlaid, including the nuclear (core) and extended (cone and cross-cone) components. These regions were defined based on the azimuthal and radial surface brightness profiles. Middle panel: azimuthal surface brightness profile of the 0.3–7 keV emission, compared with the background level, highlighting anisotropies associated with extended emission. Right panel: radial surface brightness profile of the azimuthally integrated background-subtracted 0.3–7 keV emission, compared with the normalized PSF in the same energy band. Deviations from the PSF at larger radii indicate the presence of spatially extended emission beyond the unresolved nuclear component.
Other Images in This Article
Show More
Copyright and Terms & Conditions
© 2026. The Author(s). Published by the American Astronomical Society.

