

Image Details
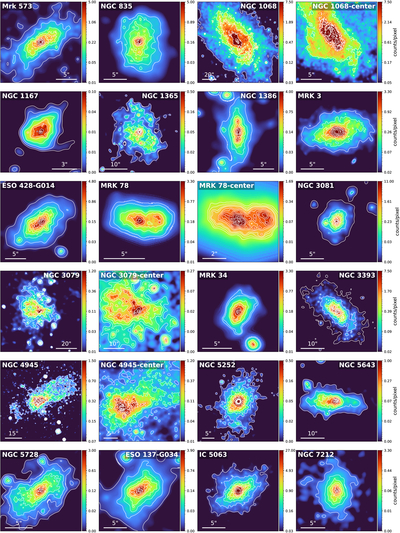
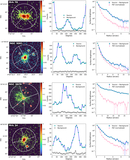
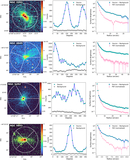
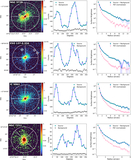
Caption: Figure 1.
Adaptively smoothed Chandra/ACIS-S images of the AGN sample. All images are shown in the full 0.3–7 keV band. North is up, east is to the left. The binning and contour values are listed in Table 23. For NGC 1068 and Mrk 78, we show two different spatial-scale images to highlight the entire emission regions and the features of the emission closer to the nucleus. Similarly, for NGC 3079 and NGC 4945, we show two different scale images to highlight both the AGN-connected bubble and its position relative to the galactic plane.
Other Images in This Article
Show More
Copyright and Terms & Conditions
© 2026. The Author(s). Published by the American Astronomical Society.

Copyright ©
2026 Astronomy Image Explorer. All Rights Reserved.
