

Image Details
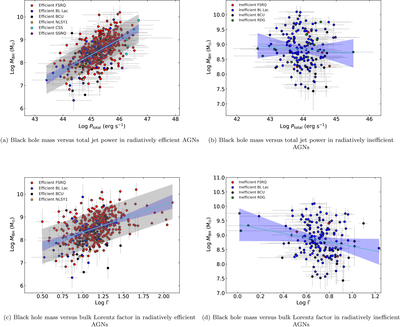
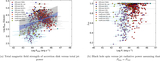
Caption: Figure 8.
Black hole mass as a function of total jet power and bulk Lorentz factor. The blue solid line represents the best-fit linear model obtained through OLS fitting. The blue shaded region indicates the 3σ confidence band, while the gray region depicts the 3σ dispersion. Data points in different colors represent different subclasses of jetted AGNs.
Other Images in This Article
Copyright and Terms & Conditions
© 2026. The Author(s). Published by the American Astronomical Society.

Copyright ©
2026 Astronomy Image Explorer. All Rights Reserved.
