

Image Details
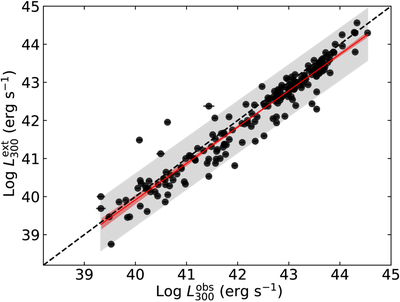
Caption: Figure 1.
Extended 300 MHz radio luminosity vs. observed 300 MHz radio luminosity for beamed blazars. The y-axis data are from R. S. Nemmen et al. (2012), while the x-axis values are the observed 151 MHz fluxes extrapolated to 300 MHz. Solid circles denote data points; the dashed line marks the equality of extended and observed luminosities. The red solid line represents the best-fit linear model obtained through ordinary least-squares (OLS) fitting; the red shaded area is the 95% confidence band, and the gray area is the 95% prediction band. The correlation coefficient for this fit is r = 0.96, which corresponds to a confidence level of 22.1σ. For several sources, the extended 300 MHz radio luminosity appears to exceed the observed luminosity, likely due to extrapolating from 151 MHz with a fixed spectral index and the nonsimultaneity of the extended and observed measurements.
Other Images in This Article
Copyright and Terms & Conditions
© 2026. The Author(s). Published by the American Astronomical Society.

