

Image Details
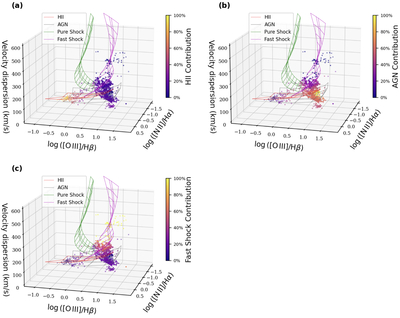
Caption: Figure A7.
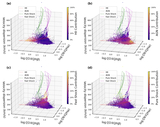
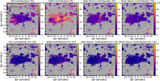
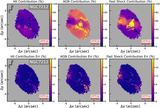
Theoretical 3D diagrams of the MUSE IFU data for NGC 7212. The panel layout and model grid parameters are the same as in Figure 1. The interactive version of this figure allows the reader to zoom and rotate any of the four panels. Hovering the mouse over a point displays the object name and its x, y, and z coordinates. In addition, the standard Plotly toolbar commands are available, including the option to reset the view to the default orientation.
An interactive version of this figure is available in the online article.
An interactive version of this figure is available.
An interactive version of this figure is available in the online journal.
Other Images in This Article
Show More
Copyright and Terms & Conditions
© 2026. The Author(s). Published by the American Astronomical Society.

