

Image Details
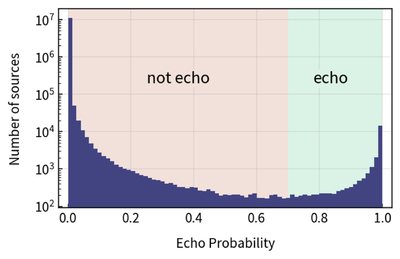
Caption: Figure 9.
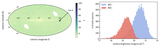
Histogram of the class probabilities of echoes for all transient candidates. The green shaded region shows candidates above our echo score threshold (shown in Figure 4), while the remaining candidates are in the red shaded region.
Other Images in This Article
Copyright and Terms & Conditions
© 2026. The Author(s). Published by the American Astronomical Society.

Copyright ©
2026 Astronomy Image Explorer. All Rights Reserved.
