

Image Details
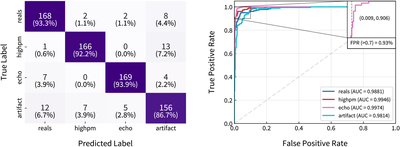
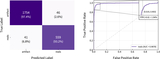
Caption: Figure 3.
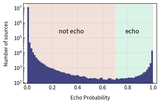
(Left) The confusion matrix for the best-performing model, as calculated using a test set of 720 candidates. The distribution of examples for each class are equal across classes. The percentages represent the fraction over the total number of sources for a particular class. (Right) The ROC curve for each class in the model, characterizing each as a one-vs-all binary classification. We determine a threshold of 0.7 for true positives of echoes at an FPR of 0.93%. The inset shows a zoom-in of the top-left edge of the curve, used to define the score threshold. A perfect classifier would have a TPR of 100% at all thresholds, while a classifier that assigns classes at random would match the diagonal dashed gray line.
Other Images in This Article
Copyright and Terms & Conditions
© 2026. The Author(s). Published by the American Astronomical Society.

