

Image Details
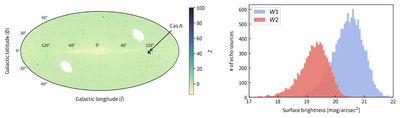
Caption: Figure 6.
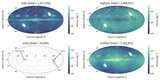
(Left) All-sky map of the test statistic Z (color bar; see text) quantifying the statistical excess of echo candidates in each sky pixel of ≈2 deg2. The location of the Cas A remnant is marked. (Right) Histogram of the estimated surface brightness of echo candidates within ≈3∘ of Cas A (Figure 5) in the W1 and W2 bands. The distributions drop off sharply at ≈21 Vega mag arcsec−2 and ≈20 Vega mag arcsec−2 in the W1 and W2 bands, respectively.
Other Images in This Article
Copyright and Terms & Conditions
© 2026. The Author(s). Published by the American Astronomical Society.

Copyright ©
2026 Astronomy Image Explorer. All Rights Reserved.
