

Image Details
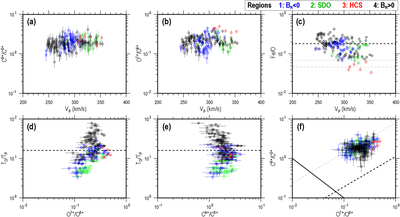
Caption: Figure 3.
Scatter plots to compare key heavy-ion parameters during the entire HCS crossing event at 0.3 au. The colors highlight data from each region defined in Figure 2 (blue: Br < 0, green: SDO, red: HCS, and black: Br > 0). (a), (b) Comparison of proton velocity and C6+/C5+ and O7+/O6+ ratios, respectively. (c) Comparison of proton velocity and Fe/O ratio. Typical values calculated from SOHO/UVCS observations are indicated by horizontal lines (black dashed line: coronal value by U. Feldman & J. M. Laming 2000; gray dotted line: photosphere values by M. Asplund et al. 2009; gray dashed line: photosphere value by N. Grevesse & A. J. Sauval 1998). (d), (e) Comparison of proton to O6+ temperature ratio as a function of O7+/O6+ and C6+/C5+ ratios, respectively. The super-mass-proportional limit (×16) is indicated by the horizontal dashed line. (f) Comparison of C6+/C5+ and O7+/O6+ ratios. The average value and outlier wind limit from L. Zhao et al. (2017a) are indicated by black and gray dashed lines. The black line on the bottom left corner shows the streamer and coronal hole boundary determined by 1 au observation (R. von Steiger & T. H. Zurbuchen 2015).
Other Images in This Article
Copyright and Terms & Conditions
© 2026. The Author(s). Published by the American Astronomical Society.

